If we destroy our homophobic defenses, we can adopt a real purpose for our lives. We can openly show with our own attitudes, particularly by what we say to others, that we accept ALL our kin with respect and love. What else is there?
(See original article for pics and diagrams.)
Since there are so many people concerned about gays and lesbians, it might be interesting to have a look at these folks to see how they compare sexually to what is questionably considered normal. To do this, we need to understand what psychologists, physicists and statisticians refer to as the normal curve.
Just for fun, suppose you are paid $20 to take a test in a language you don’t understand. There are 50 questions. As a result, each question is pure nonsense to you. Nevertheless, you are asked to circle either the word TRUE or FALSE at the end of each question. You are given only 5 minutes to circle all your answers.
Quickly, you and the other 100 persons involved realize the foolishness of this quiz. You race down the columns circling TRUE or FALSE at random. When finished, you pick up your $20 and leave. Within 5 minutes, the room is empty except for the examiners who’ve collected all the tests.
Imagination is unnecessary to predict the results. Since no one could understand any of the questions, each person had to answer like you did—at random! Obviously, some would do much better than others by sheer chance. If the examiners were to graph their results, they would end up with an array of scores that would generate a normal curve like the one I made up below.
What does this mean? The graph shows that only 1 person guessed 84 questions correctly while only 1 got 18 correct. Most of the test scores ended up in the middle between 40 correct and 60 correct. This is called a normal distribution (Encarta). It is critical to note that no one should feel bad about the results. Every person who took the test was equally capable of scoring anywhere within the spectrum.
This chart and its logic is used in all kinds of situations. In my own field as an educator, this type of graph is often used to show test results. For example, the Scholastic Aptitude Test (SAT) is used to identify students who would have a high probability of success in a College or University.
Students normally earn a score of 200-800. A score of 500 is perfect center for that distribution of students. Obviously, the higher you score be yond the 500 mark, the greater your chance of acceptance in a respectable school. What’s important here is that regardless of score, ALL who take the test are people with their own inborn abilities.
Intelligence Quotient (IQ) is often used in grouping students in school from primary grades up through higher education. While employers seek to fill positions by examining a variety of scores in a particular field of expertise, I would not be surprised if some still take a peek at an applicant’s IQ score. Personally, I’d rather not know my own score.
This particular number seems to follow you for a lifetime. If charted using the curve above, most of us have an IQ which hovers around 100. Slower students would have a score around 70, whereas students with giftedness generally have scores above 130 (Pennsylvania Standards and Regulations). What is important: Regardless of an achieved score, ALL students need an appropriate education developing abilities they are born with.
I’m sure there are any number of personal qualities beside intelligence that can be graphed according to the normal distribution curve. For example, type of body physique. I used to envy the few boys in my high school gym class who were extremely muscular by nature: mesomorphic (Men’s Total Fitness).
They did n othing to achieve their ripped, hunk-like physiques—simply put, they were born with them. By the same token, there were those of us who were somewhat scrawny, like me, ectomorphic (A 2 Z of Health, Beauty and Fitness), and gained little weight or muscle mass regardless of food habits and/or exercise.
But what we must not forget: ALL of us were born with different traits, intelligence, body types; and we all seek respect and love. We cannot cease to be because we do not fit some normal curve distribution. All of us fit somewhere on the that curve.
Several years ago when I taught my middle school class, the teacher in the classroom next door taught students who where diagnosed as seriously emotionally maladjusted. I deliberately use the word maladjusted because I hated the word disturbed then, and I hate it even more, now.
On a normal curve, maladjustment can be objectively measured and compared to a regular student’s adjustment by observation; judging emotional disturbance seems more like subjective guesswork. Of importance here is that a student, whether maladjusted or normal, can be taught how to adjust to various circumstances.
The Sexual Behavior in the Human Male (1948) and the Sexual Behavior in the Human Female (1953) known jointly as the Kinsey Reports, use a 0-6 scale to chart strictly heterosexual behavior, a “0”, as opposed to purely homosexual behavior a “6”. These scores were then converted to percentages.
Reportedly, over 18,000 people took part in the Kinsey study. [I am aware that religious folks, scientists, psychologists, lawyers, and statisticians, have attempted to debunk the Kinsey Reports. Some are: Catholic Medical Quarterly (1992), Kinsey: Crimes and Consequences (1997); The Alec Report of Kinsey (2004).]
The Kinsey Report discloses that:
• 46% of adult males studied admitted to reacting sexually to both sexes.
• 37% of adult men admitted having one homosexual experience.
• 11.6% of white males, aged 20-35, were rated as equally hetero- and homosexual.
Furthermore:
• 7% of single females, aged 20-35, were rated as equally hetero- and homosexual.
• 4% of previously married females, aged 20-35, were rated as equally hetero- and homosexual.
• 2 to 6% of females, aged 20-35, were more or less exclusively homosexual in responses about their experiences.
• 1 to 3% of unmarried females aged 20-35 were exclusively homosexual in responses to their experiences.
In my mind, the Kinsey 7 point scale (0-6) and resulting percentages fracture human sexuality into static male and female behaviors. It treats each sex as sheep and goats as if they have nothing in common as beings, even though the report claims that:
“The world is not to be divided into sheep and goats. It is a fundamental of taxonomy that nature rarely deals with discrete categories... The living world is a continuum in each and every one of its aspects.”
In opposition to the reporting done by Kinsey and others, I feel that every human organism should be looked upon as behaving in a female – male continuum regardless of whether the organism is a male/female body.
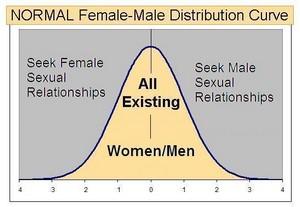
I would like to posit the following NORMAL distribution curve to include all humans as being perfectly normal regardless of their sexual inclinations and body organs. This is because I personally believe every human being either at some time during their lifetime, or for a whole lifetime, has some innate sexual attraction for their same sex. While this belief might be accepted by women, I doubt it would be acceptable with most men I know or have known, particularly those who feel compelled to display irrational homophobic behavior.
According to this NORMAL curve, sexuality ranges from women or men or transgender individuals seeking female relationships on the left, to those on the right seeking male relationships. As such, every single human being on this planet has existence somewhere under the NORMAL bell shape.
Obviously, there will be a large cluster of both men and woman near the center who, while they know they are attracted at times to their own gender, still prefer union with sexual opposites. This includes transgender individuals. The numbers below the bottom line represent standard deviations from the norm.
At first glance, it might seem that the curve should be drawn so that it is somewhat flat on top and skewed to each side (female and male). But as it is drawn above where most men and women are in the center, it would seem both sexes react to the opposite sex and the same sex as a part of normal behavior. I believe this to be true .
In view of the Kinsey report mentioned above that 46% of adult males studied admitted to reacting sexually to both sexes, I question if the chart needs skewed at all! The report mentioned 46% of men admitting their reaction to both sexes. One wonders if the 60 year old study was redone today, how many more people might feel liberated enough to admit having same sex attraction.
To sum up, in my way of thinking, human organisms have being. We exist. Sexuality is one expression of our ens. When we scorn, reject, or what’s worse—psychologically or bodily damage—another living human because we disapprove of their lifestyle, we are guilty of crime. It is not just a transgression against that individual, we are hating and injuring our very own humanity as well.
For what outlandish purpose we exist on this planet seems a moot point. It appears to be a frustrating, yet intoxicating, paradox. But if we destroy our homophobic defenses, we can adopt a real purpose for our lives. We can openly show with our own attitudes, particularly by what we say to others, that we accept ALL our kin with respect and love. What else is there?
|